MEETINGS REGISTRY DEMO

This demo cloudlet tracks the effort spent by employees to attend meetings. It also calculates statistics of the toal time spent per project and per customer.
In this page you can submit some GraphQL queries to the cloudlet and also explore its model. If you want to go further (e.g. modify and regenerate it) create a new instance of the cloudlet in your Livebase account using the resources (model and sample data) available here.
Play with the GraphQL API
of this demo cloudlet
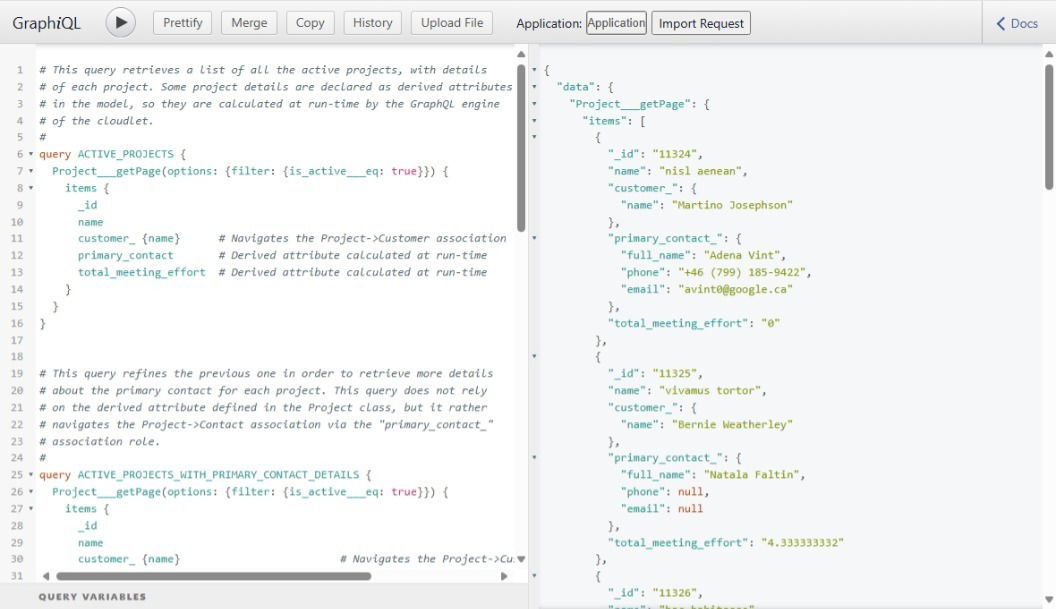
We have preconfigured a GraphiQL console already connected to the cloudlet API, with a few predefined queries the help you getting started, You can also write your own queries (check the "Docs" section on the top-right corner of the console).
- Click here to open the GraphiQL console;
- login as "guest" (password = "guest");
- press the Play button to execute the predefined queries in the left panel (or write your own ones);
- check the results in the right panel.
GraphiQL is an open-source GraphQL integrated development environment (IDE).
Check this tutorial to learn more about this tool
.
Explore the model
used to generate the cloudlet
The model consists of a single diagram drawn on three layers named "schemas", as described hereunder. Each schema defines a different aspect of the GraphQL engine (database, applications, permissions), like thematic layers on a geographical map.
- Click on the tabs to view the corresponding schema.
- Click on any part of the diagram to show a description of the corresponding model element.
- Move the mouse over a blue word in the description to highlight the corresponding model element in the diagram.